2024 Economic County Snapshots for North Carolina
The Economic County Snapshots are one of BTC’s flagship annual publications. They provide key economic and social indicators from publicly available sources for all 100 counties in North Carolina, along with a comparison to state-level data, with measures for employment, poverty and income, affordable housing, health, education, and more.
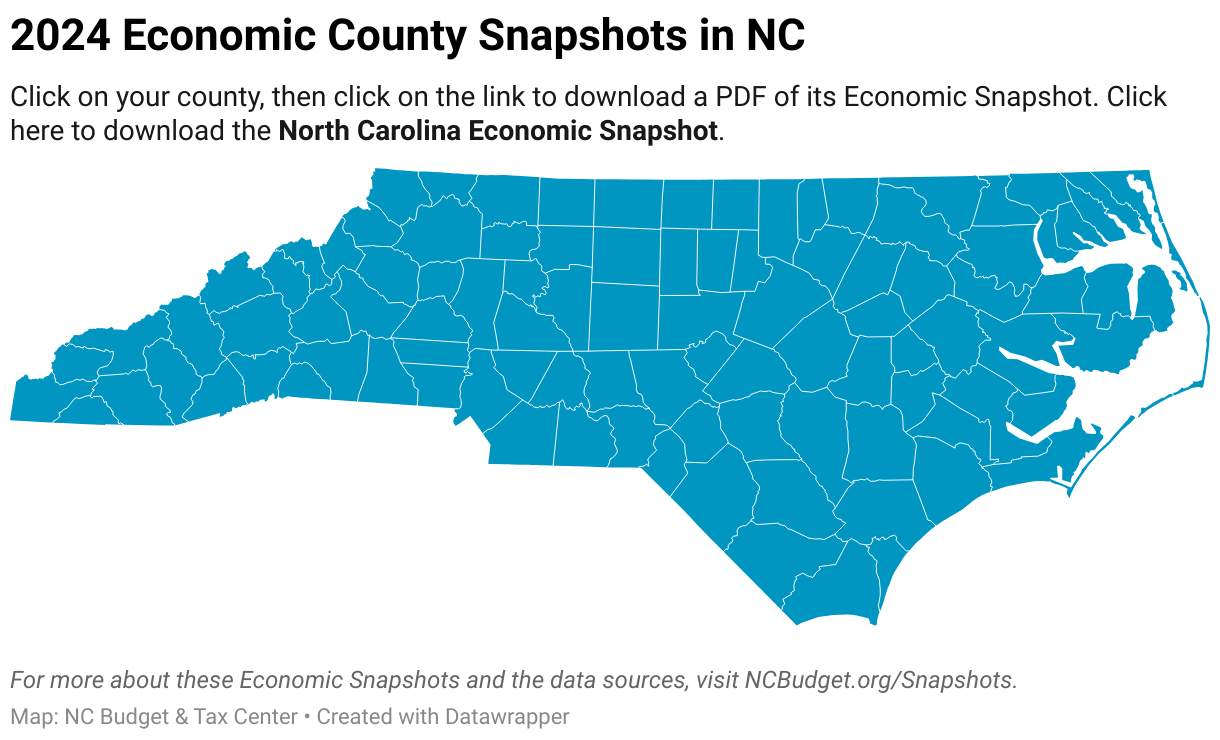
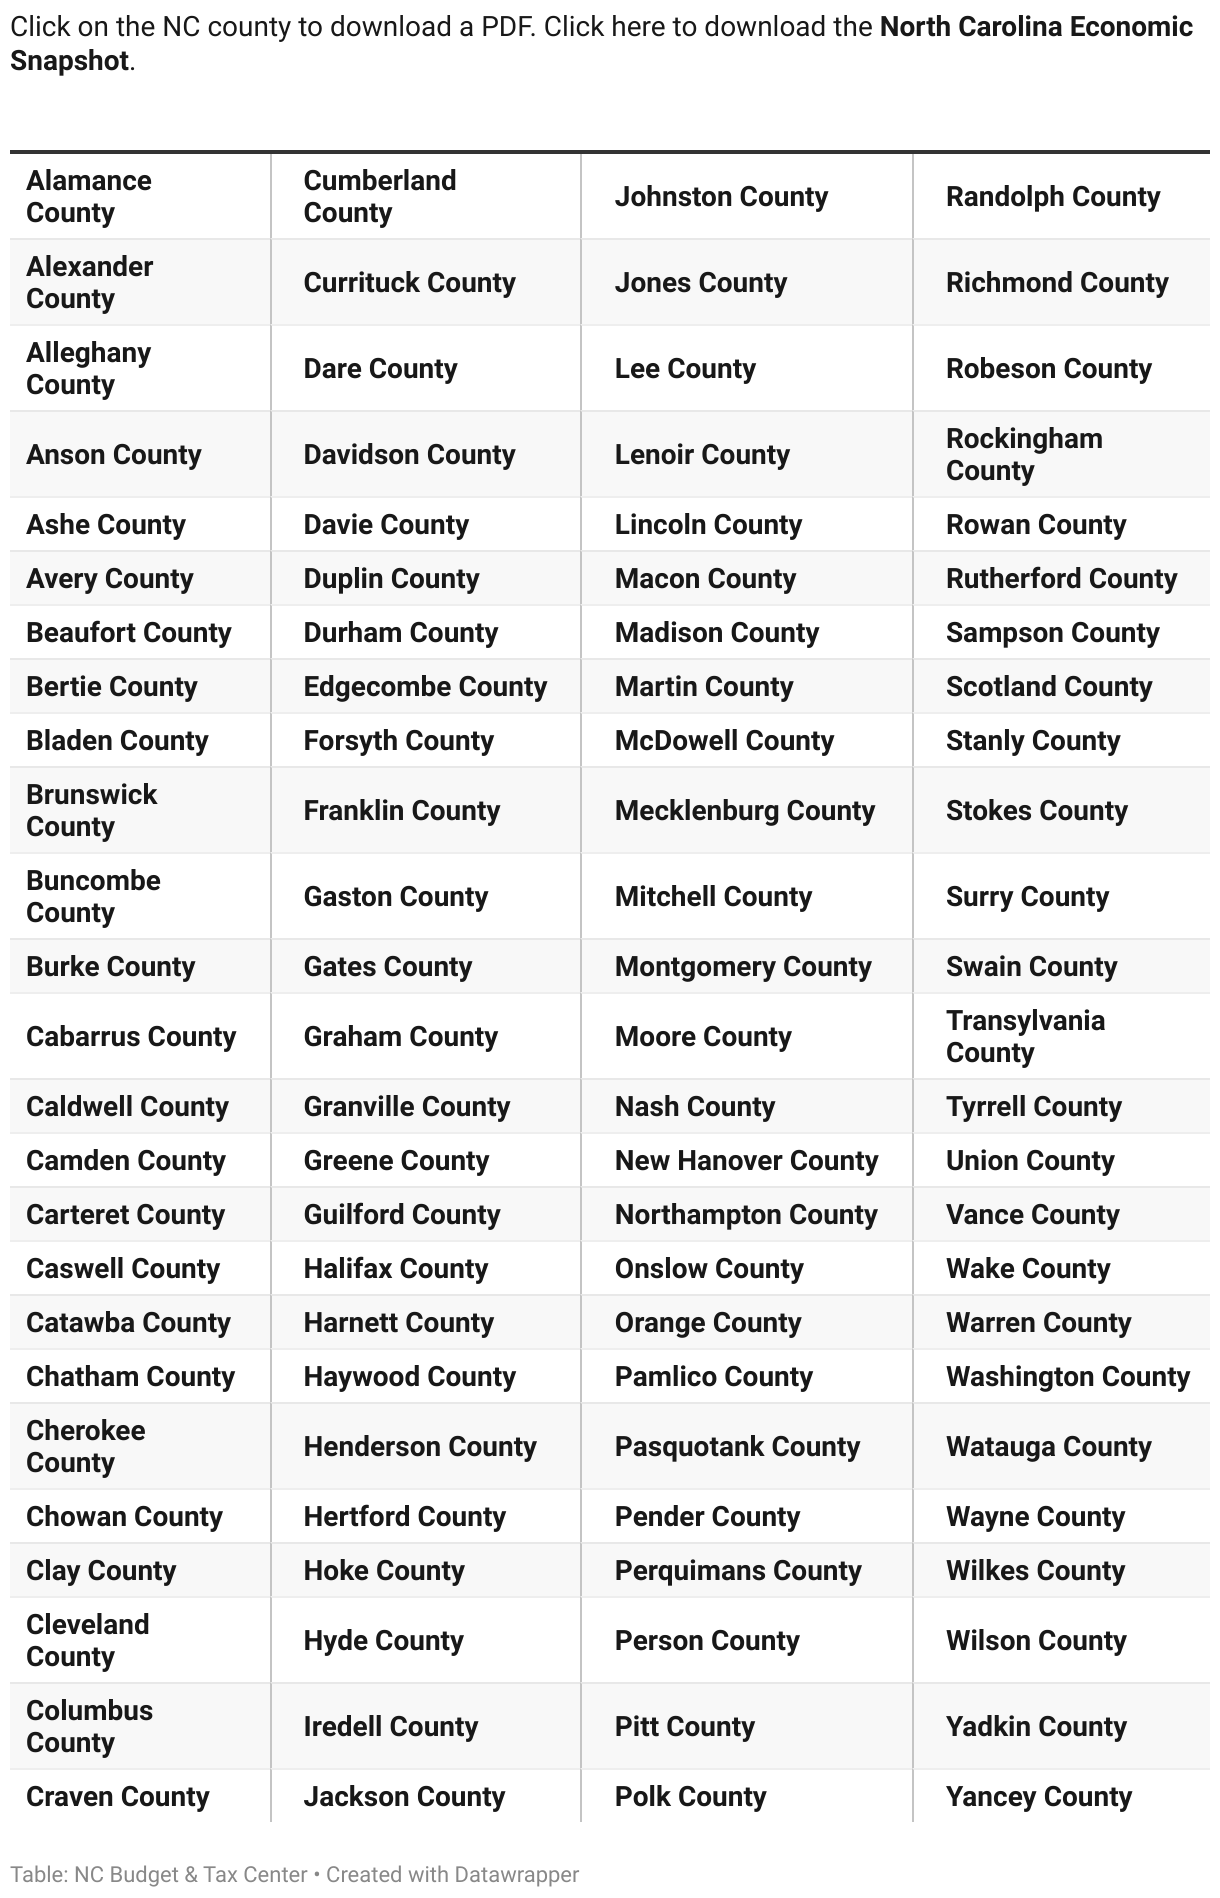
The Snapshots are available for each county as an individual pdf that you can download here, and through interactive maps and charts on this page that allow for easier comparisons across counties for many of the measures. If you’d like to download the numbers for your own use, the data is available in a Google spreadsheet here, or you can download an Excel file here. For detailed information about where the data comes from and any limitations, see our sources and methodology.
If you have questions about the data, additional measures you’d like to see for your county, or ideas for how to put the Snapshots to use in your community, reach out at info@ncbudget.org.
Navigate to a specific section of this page by clicking one of the links below.
Income and the Ability to Afford the Basics
Income — for individual people and for families — is one of the most foundational ways we experience the economy. No matter what we look like or where we come from, we all need to buy groceries for our families, pay our bills each month, and purchase clothes and school supplies for our children. Our Snapshots include data on household incomes along with average worker earnings, and they compare these to a Living Income Standard, a measure of what it takes to pay for the basics that we all need. People drive the economy, and to ensure that workers receive a thriving income we need to come together to make sure the fruits of their labor don’t go to wealthy shareholders and CEOs. State governments can step up to protect workers and to support family incomes so that communities — and state economies — thrive: 30 states have set a minimum wage higher than the federal minimum, and Michigan made headlines for repealing its anti-union “right to work” law. Combined with public investments that keep necessities like child care and housing affordable, supporting workers can boost incomes to drive greater prosperity for the North Carolinians who power our economy.
Poverty and Economic Hardship
Our economy works best when every North Carolinian – Black, white, and brown — is empowered to reach their potential and contribute their talents to our communities. When some people are living in poverty, we know the economy isn’t working for everyone. Through its severe and negative impacts on health, education, and child development, poverty blocks too many people in our state from flourishing. We include data on poverty rates by race because we know that Black, American Indian, and Latine North Carolinians are especially impacted by structural barriers that block access to high-wage jobs. Child poverty rates — which are significantly higher than overall rates — are another key indicator because poverty is especially harmful for children. Yet poverty in North Carolina is a policy choice: Before lawmakers allowed it to expire, the pandemic-era federal Child Tax Credit slashed child poverty in our state by more than 40 percent. It is within our power to demand policies that make poverty a thing of the past in North Carolina.
Employment
In a strong state economy, every North Carolinian who seeks employment can secure a job that meets their family’s needs. High-quality jobs aren’t just about wages, but can give us a sense of purpose and meaning, while the labor of teachers, bus drivers, health professionals, early childhood educators, and so many others keep our communities going every day. The County Economic Snapshots include the unemployment rate, along with how the number of people working across the state has changed over time, both since the onset of the COVID pandemic and since the Great Recession, showing how job growth is increasingly concentrated in urban areas. As federal investments to tackle climate change and fund infrastructure flow to NC, our state has an enormous opportunity to ensure that the green jobs of the future are high-wage, high-quality, and accessible to North Carolinians who have been historically excluded from economic opportunity.
Educational Attainment
Increased educational attainment is associated with higher earnings and employment rates, better health, and greater civic participation. We all do better when every person in North Carolina can access excellent public education and high-quality postsecondary education or training to achieve their goals. The County Snapshots include high school graduation rates by race because tackling racial disparities is crucial for ensuring every child gets the sound, basic education guaranteed in our state constitution. We also look at bachelor’s degrees and earnings by gender, revealing that while women in nearly every county are more likely to have completed college, substantial gaps in earnings persist for women and men with the same level of education. An economy for all requires state investments in public education like those outlined in the Leandro Plan, in high-quality and affordable community colleges and universities, and in strengthening key systems like child care that drive economic opportunity for women.
Access to Affordable Housing
Everyone deserves a safe home for themself and their family where they can afford to pay their rent or mortgage without cutting back on other needs like healthy food or doctor’s visits. These data show that too many NC renters, due to a combination of lack of affordable housing and low incomes, are “cost-burdened,” spending more than 30 percent of their income on rent. We also include data on how many people face “severe rent burden,” meaning more than half their income goes to rent each month, and on what it would take to afford rent while earning the state minimum wage of $7.25 per hour. The National Low Income Housing Coalition estimates that North Carolina has a shortage of over 200,000 rental homes that are accessible to extremely low-income renters. Our state has tools to meet this housing crisis head-on, from a Housing Trust Fund that has successfully produced tens of thousands of units, to an emergency rental assistance program that kept thousands of tenants housed during a public health crisis. Together, North Carolinians can demand our leaders invest public dollars in these proven tools.
Healthy Lives and Communities
People drive our economy, so a healthy economy needs healthy people. The County Snapshots look at access to health care through insurance rates and the availability of mental health care providers. We also include data on rates of food assistance that helps people afford nourishing food, and on life expectancy, which we know is driven in part by economic security. More than a decade after the implementation of the Affordable Care Act, North Carolina’s legislative leaders finally voted to expand access to Medicaid in 2023. For the 600,000 low-income residents who were previously left uncovered, the expansion was long overdue. The estimated economic benefits of expansion – reduced barriers to work, increased worker financial stability, and over $240 million annually in increased state and local tax revenues – underscore the link between people’s health and a thriving state economy.
Download your County Economic Snapshot
2024 County Economic Snapshots Data Sources and Methodology Notes
This information is organized in the order it appears on the individual county PDFs. The maps and charts include information about data sources on the visualization where the data appears.
Much of the data we use in the County Economic Snapshots come from the U.S. Census Bureau’s American Community Survey (ACS). This ongoing survey releases data in December of every year for the previous year (for example, 2022 data was released in December 2023.) The ACS reports data for areas with a small population using a 5-year average, which is why 2018-2022 is shown as the time period for ACS data in the Snapshots. Some ACS estimates have high margins of error, because they are based on small sample sizes, and in some cases (discussed below) we exclude data with very high margins of error. In general, ACS data is less reliable for counties with smaller populations. You can learn more about the ACS here.
Front Page of Economic County Snapshot
Population
- NC Office of State Budget and Management, County Population Totals, July 2014 (certified) and July 2024 (projected). Available at https://demography.osbm.nc.gov.
Rental affordability
- U.S. Census Bureau, American Community Survey, 2018-2022, Table B25070. Available at https://data.census.gov/.
Health insurance
- U.S. Census Bureau, American Community Survey, 2018-2022, Table S2701. Available at https://data.census.gov/.
Mental health providers
- University of Wisconsin Population Health Institute and Robert Wood Johnson Foundation, 2023 County Health Rankings, North Carolina. Available at https://www.countyhealthrankings.org/app/north-carolina/2023/measure/factors/62/data.
Candidates per job opening
- NC Works Online, Supply and Demand Detail for North Carolina, Jobs and Candidates Area Distribution. Available at https://www.ncworks.gov/vosnet/dashboards/defaultana.aspx?menuid=MENU_START_PAGE_DASHBOARD_ANA. Downloaded February 2024.
- Job Source: Online advertised jobs data
- Candidate Source: Individuals with active resumes in the workforce system willing to work in the county. (Note that candidates are duplicated across counties if they are willing to work in multiple counties.)
Employment compared to pre-COVID-19 and pre-Great Recession
- NC Department of Commerce, Local Area Unemployment Statistics, Unadjusted (not seasonally adjusted) Employed data for December 2007, February 2020, and December 2023. Available at https://d4.nccommerce.com/LausSelection.aspx.
People with low incomes (Below 200% of the poverty level)
- U.S. Census Bureau, American Community Survey, 2018-2022, Table B17024. Available at https://data.census.gov/.
Incomes of the richest 5% of households compared to the poorest 20% of households
- U.S. Census Bureau, American Community Survey, 2018-2022, Table B19081. Available at https://data.census.gov/.
Back Page of Economic County Snapshot
Table 1: Poverty and Economic Hardship
- U.S. Census Bureau, American Community Survey, 2018-2022, Tables S1701, B17020D, and B17020E. Available at https://data.census.gov/cedsci/.
- The poverty rate for Asian and Pacific Islanders combines data for the race categories “Asian alone” and “Native Hawaiian and Other Pacific Islander Alone.”
- The Census Bureau measures race and Hispanic origin as separate categories meaning people who identify their ethnicity as “Hispanic or Latino” may be of any race. Here “Latine” refers to people of any race who identify as Hispanic or Latino. “White” refers only to people who do not identify as Hispanic or Latino. All other race categories include people who identify as that race regardless of Hispanic or Latino origin. To learn more about the Census categories see https://www.census.gov/topics/population/race/about.html and https://www.census.gov/topics/population/hispanic-origin.html
- We excluded poverty rates with a margin of error higher than the estimate.
Table 2: Employment
- NC Department of Commerce, Local Area Unemployment Statistics, Unadjusted (not seasonally adjusted) Employed, Unemployed, and Unemployment Rate data for February 2020, and December 2023. Available at https://d4.nccommerce.com/LausSelection.aspx.
Table 3: Educational Attainment
High school graduation
- NC Department of Public Instruction, Cohort Graduation Rate Data for 2022 - 2023. Available at https://accrpt.tops.ncsu.edu/docs/cgrdisag_datasets/.
- NC State Board of Education and Department of Public Instruction Statistical Profile, State Summary, Pupil Information, Table 10 – Pupils in Membership by Race & Sex and Local Education Agencies, Pupil Accounting, Table A1 – Final Pupils by Year and Grade. Available at http://apps.schools.nc.gov/ords/f?p=145:1.
- The graduation rate is percent of public school students who entered high school as 9th graders in the 2019-2020 school year who graduated in the 2022-2023 school year.
- For counties with multiple Local Education Agencies (a.k.a. school districts), county graduation rates are estimated based on the enrollment in each district within the county.
- The Department of Public Instruction doesn’t report graduation rates by race if that group makes up over 95% or less than 5% of students in a school district. They also do not report exact percentages for graduation rates greater than 95%, which is why >95% appears in some cases.
College degrees
- Data on bachelor’s degrees is for the population ages 25 and over.
- U.S. Census Bureau, American Community Survey, 2018-2022, Tables S1501 and S2001. Available at https://data.census.gov/cedsci/.
Table 4: Income and Ability to Afford the Basics
Living Income Standard
- NC Budget & Tax Center, Living Income Standard, 2022. Available at https://ncbudget.org/lis/.
Median earnings and income
- U.S. Census Bureau, American Community Survey, 2018-2022, Tables S2001 and S1901. Available at https://data.census.gov/cedsci/.
- Data on median worker earnings is for workers ages 25 and over.
Table 5: Access to Affordable Housing
Rent burden
- U.S. Census Bureau, American Community Survey, 2018-2022, Table B25070. Available at https://data.census.gov/cedsci/.
Fair market rent
- HUD Office of Policy Development and Research, Fair Market Rents (40th Percentile Rents). Available at https://www.huduser.gov/portal/datasets/fmr.html.
- The hours required to afford a two-bedroom home at fair market rent is based on North Carolina’s minimum wage of $7.25 per hour and the definition of affordability that housing costs no more than 30% of income. We use this measure based on the annual Out of Reach report published by the National Low Income Housing Coalition. The steps to calculate this measure are:
Table 6: Healthy Lives and Communities
Health insurance
- U.S. Census Bureau, American Community Survey, 2018-2022, Table S2701. Available at https://data.census.gov/.
Life expectancy
- NC State Center for Health Statistics, 2020 State of North Carolina and 2018-2020 County Life Expectancy at Birth. Available at https://schs.dph.ncdhhs.gov/data/lifexpectancy/.
Mental health providers
- University of Wisconsin Population Health Institute and Robert Wood Johnson Foundation, 2023 County Health Rankings, North Carolina. Available at https://www.countyhealthrankings.org/app/north-carolina/2023/measure/factors/62/data.
Food assistance
- NC Department of Health and Human Services, Food and Nutrition Services Caseload Statistics Reports, FNS Cases and Participants, December 2023. Available at https://www.ncdhhs.gov/divisions/social-services/program-statistics-and-reviews/fns-caseload-statistics-reports.
- Percent of people receiving SNAP is calculated using total SNAP participants divided by 2024 population.